Cost Comparison
Compare any two periods. See what changed, and why.
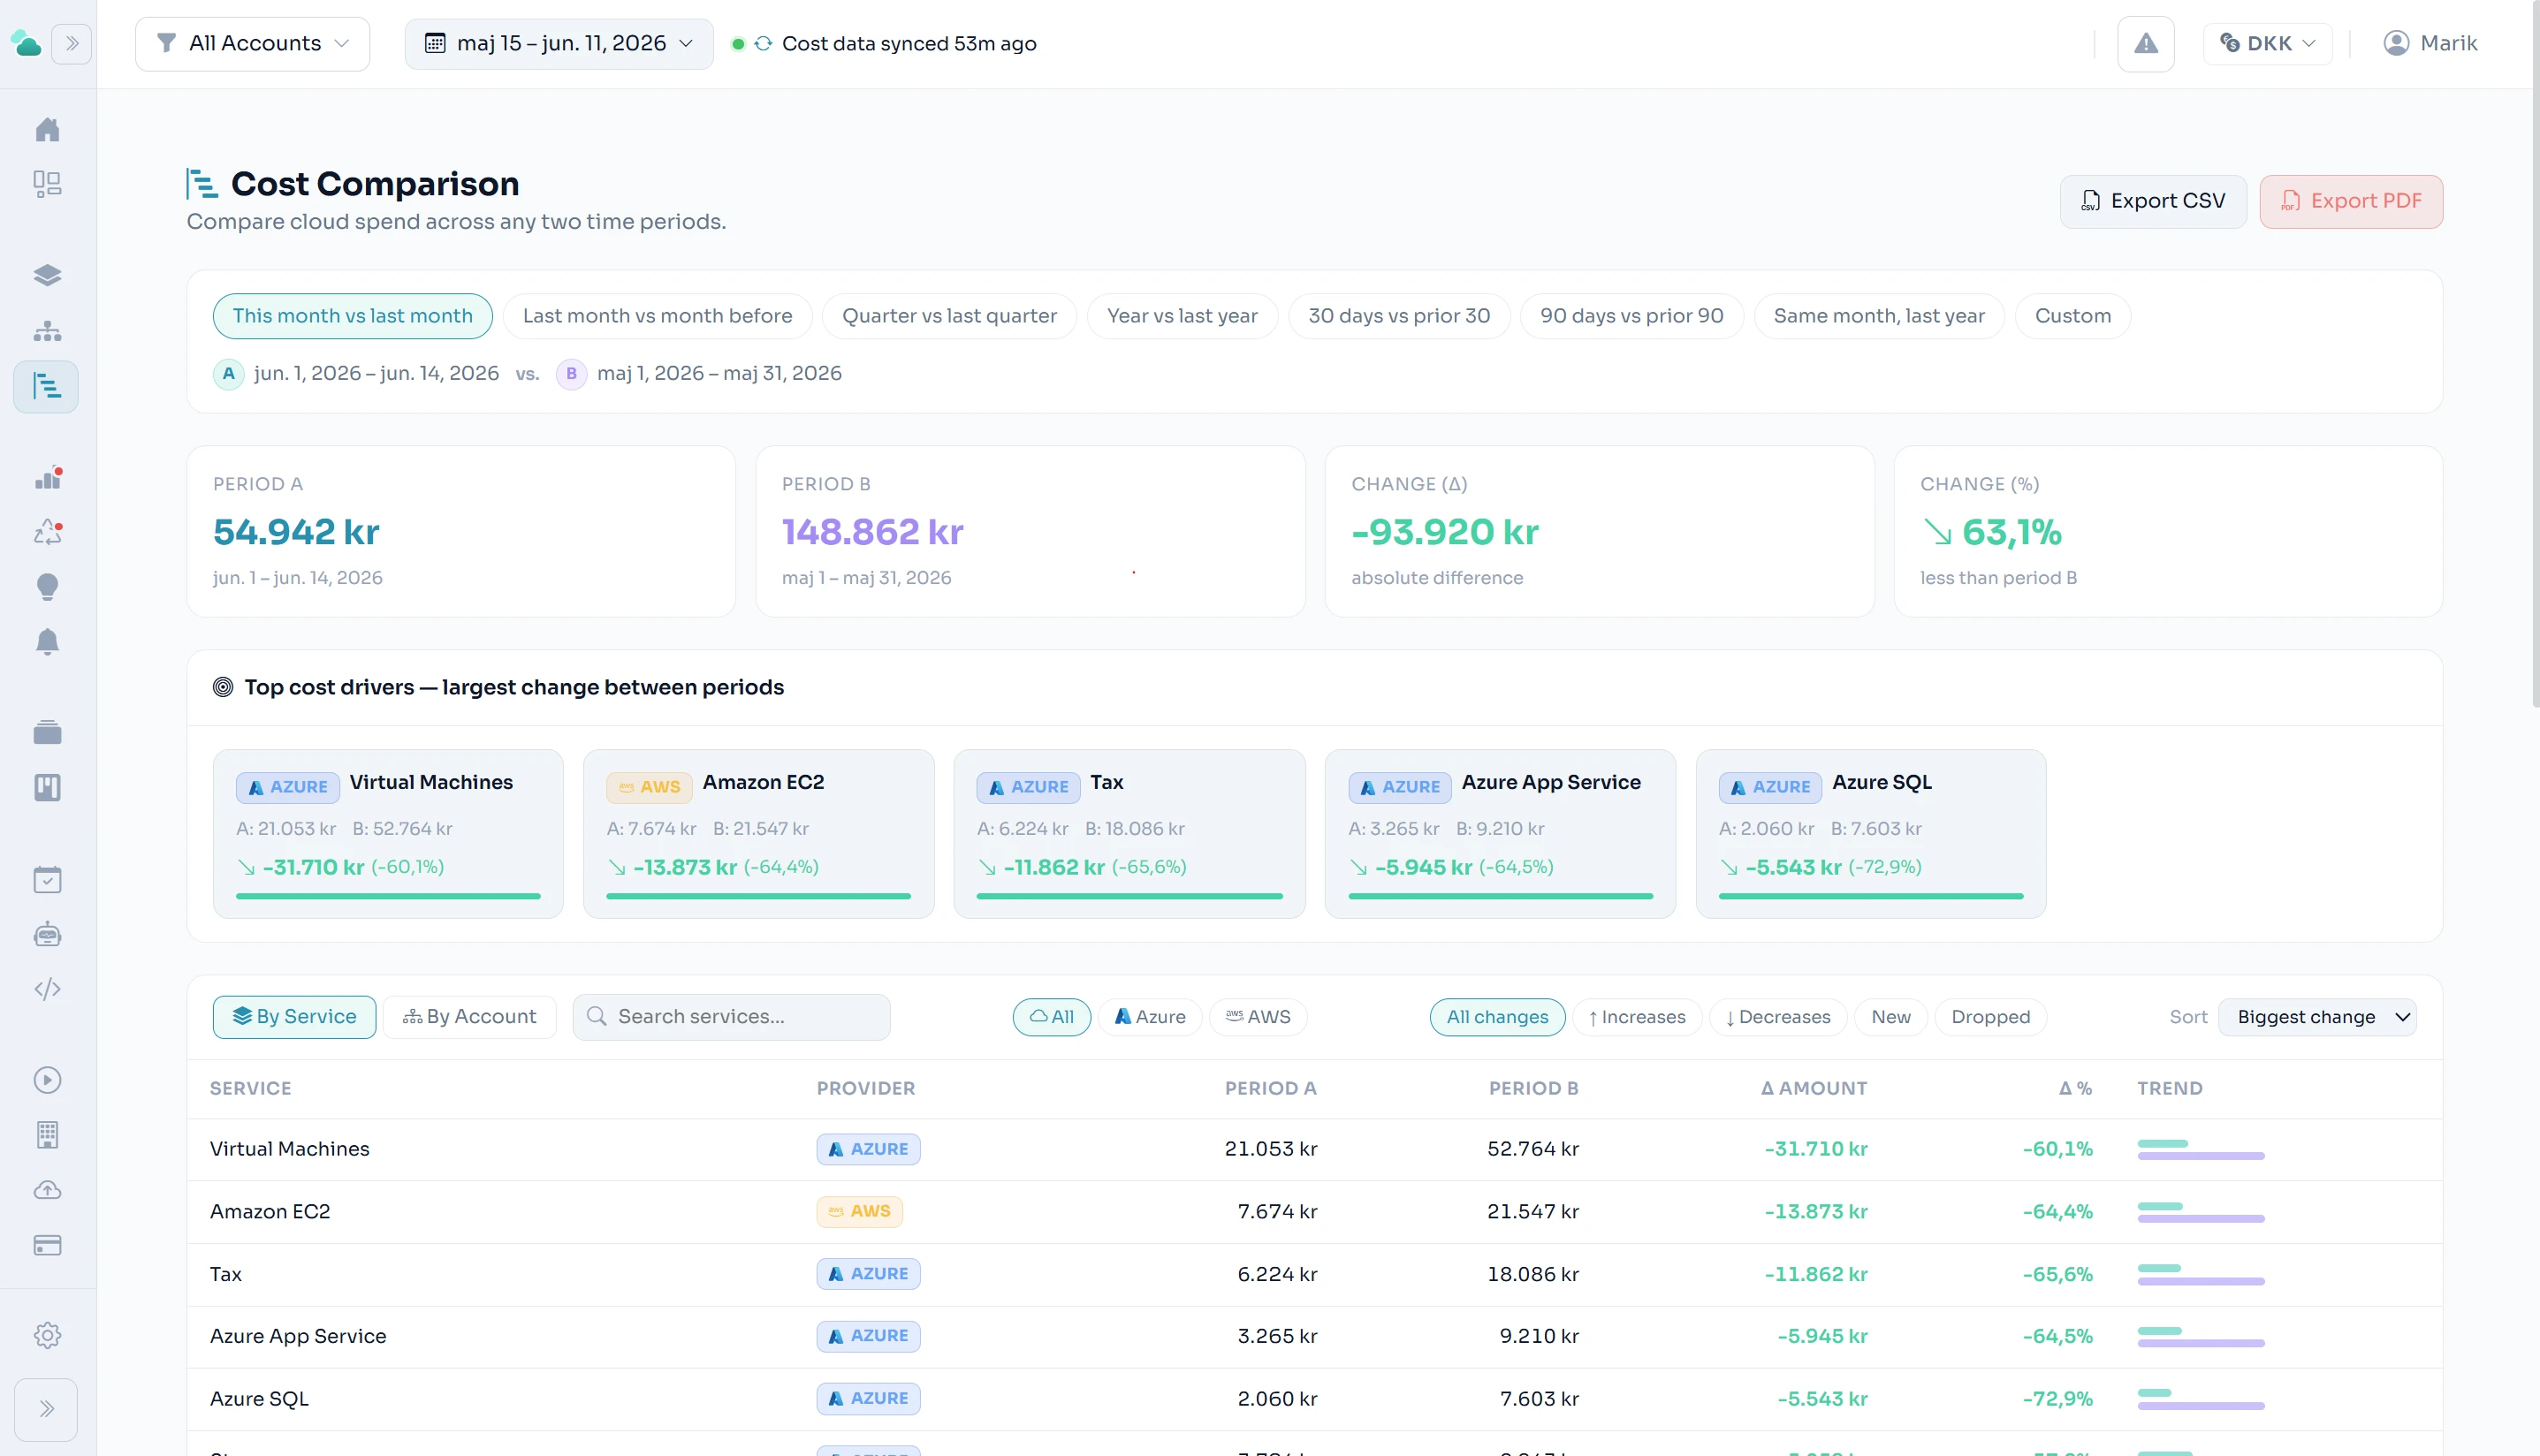
Put this month against last month, this year against last year, or any custom window — and instantly see the services and accounts that drove the change.
One-click presets
Month over month, quarter over quarter, year over year — or fully custom ranges.
Top cost drivers
The largest increases and decreases between periods, ranked and explained.
Drill-down table
Per-service and per-account deltas with direction, amount, and percentage.
Export-ready
Take any comparison to the business as CSV or PDF.
Related features
See it on your numbers.
Early access — a new platform, onboarding teams now.