Dashboards & Custom Views
Your numbers, arranged your way.
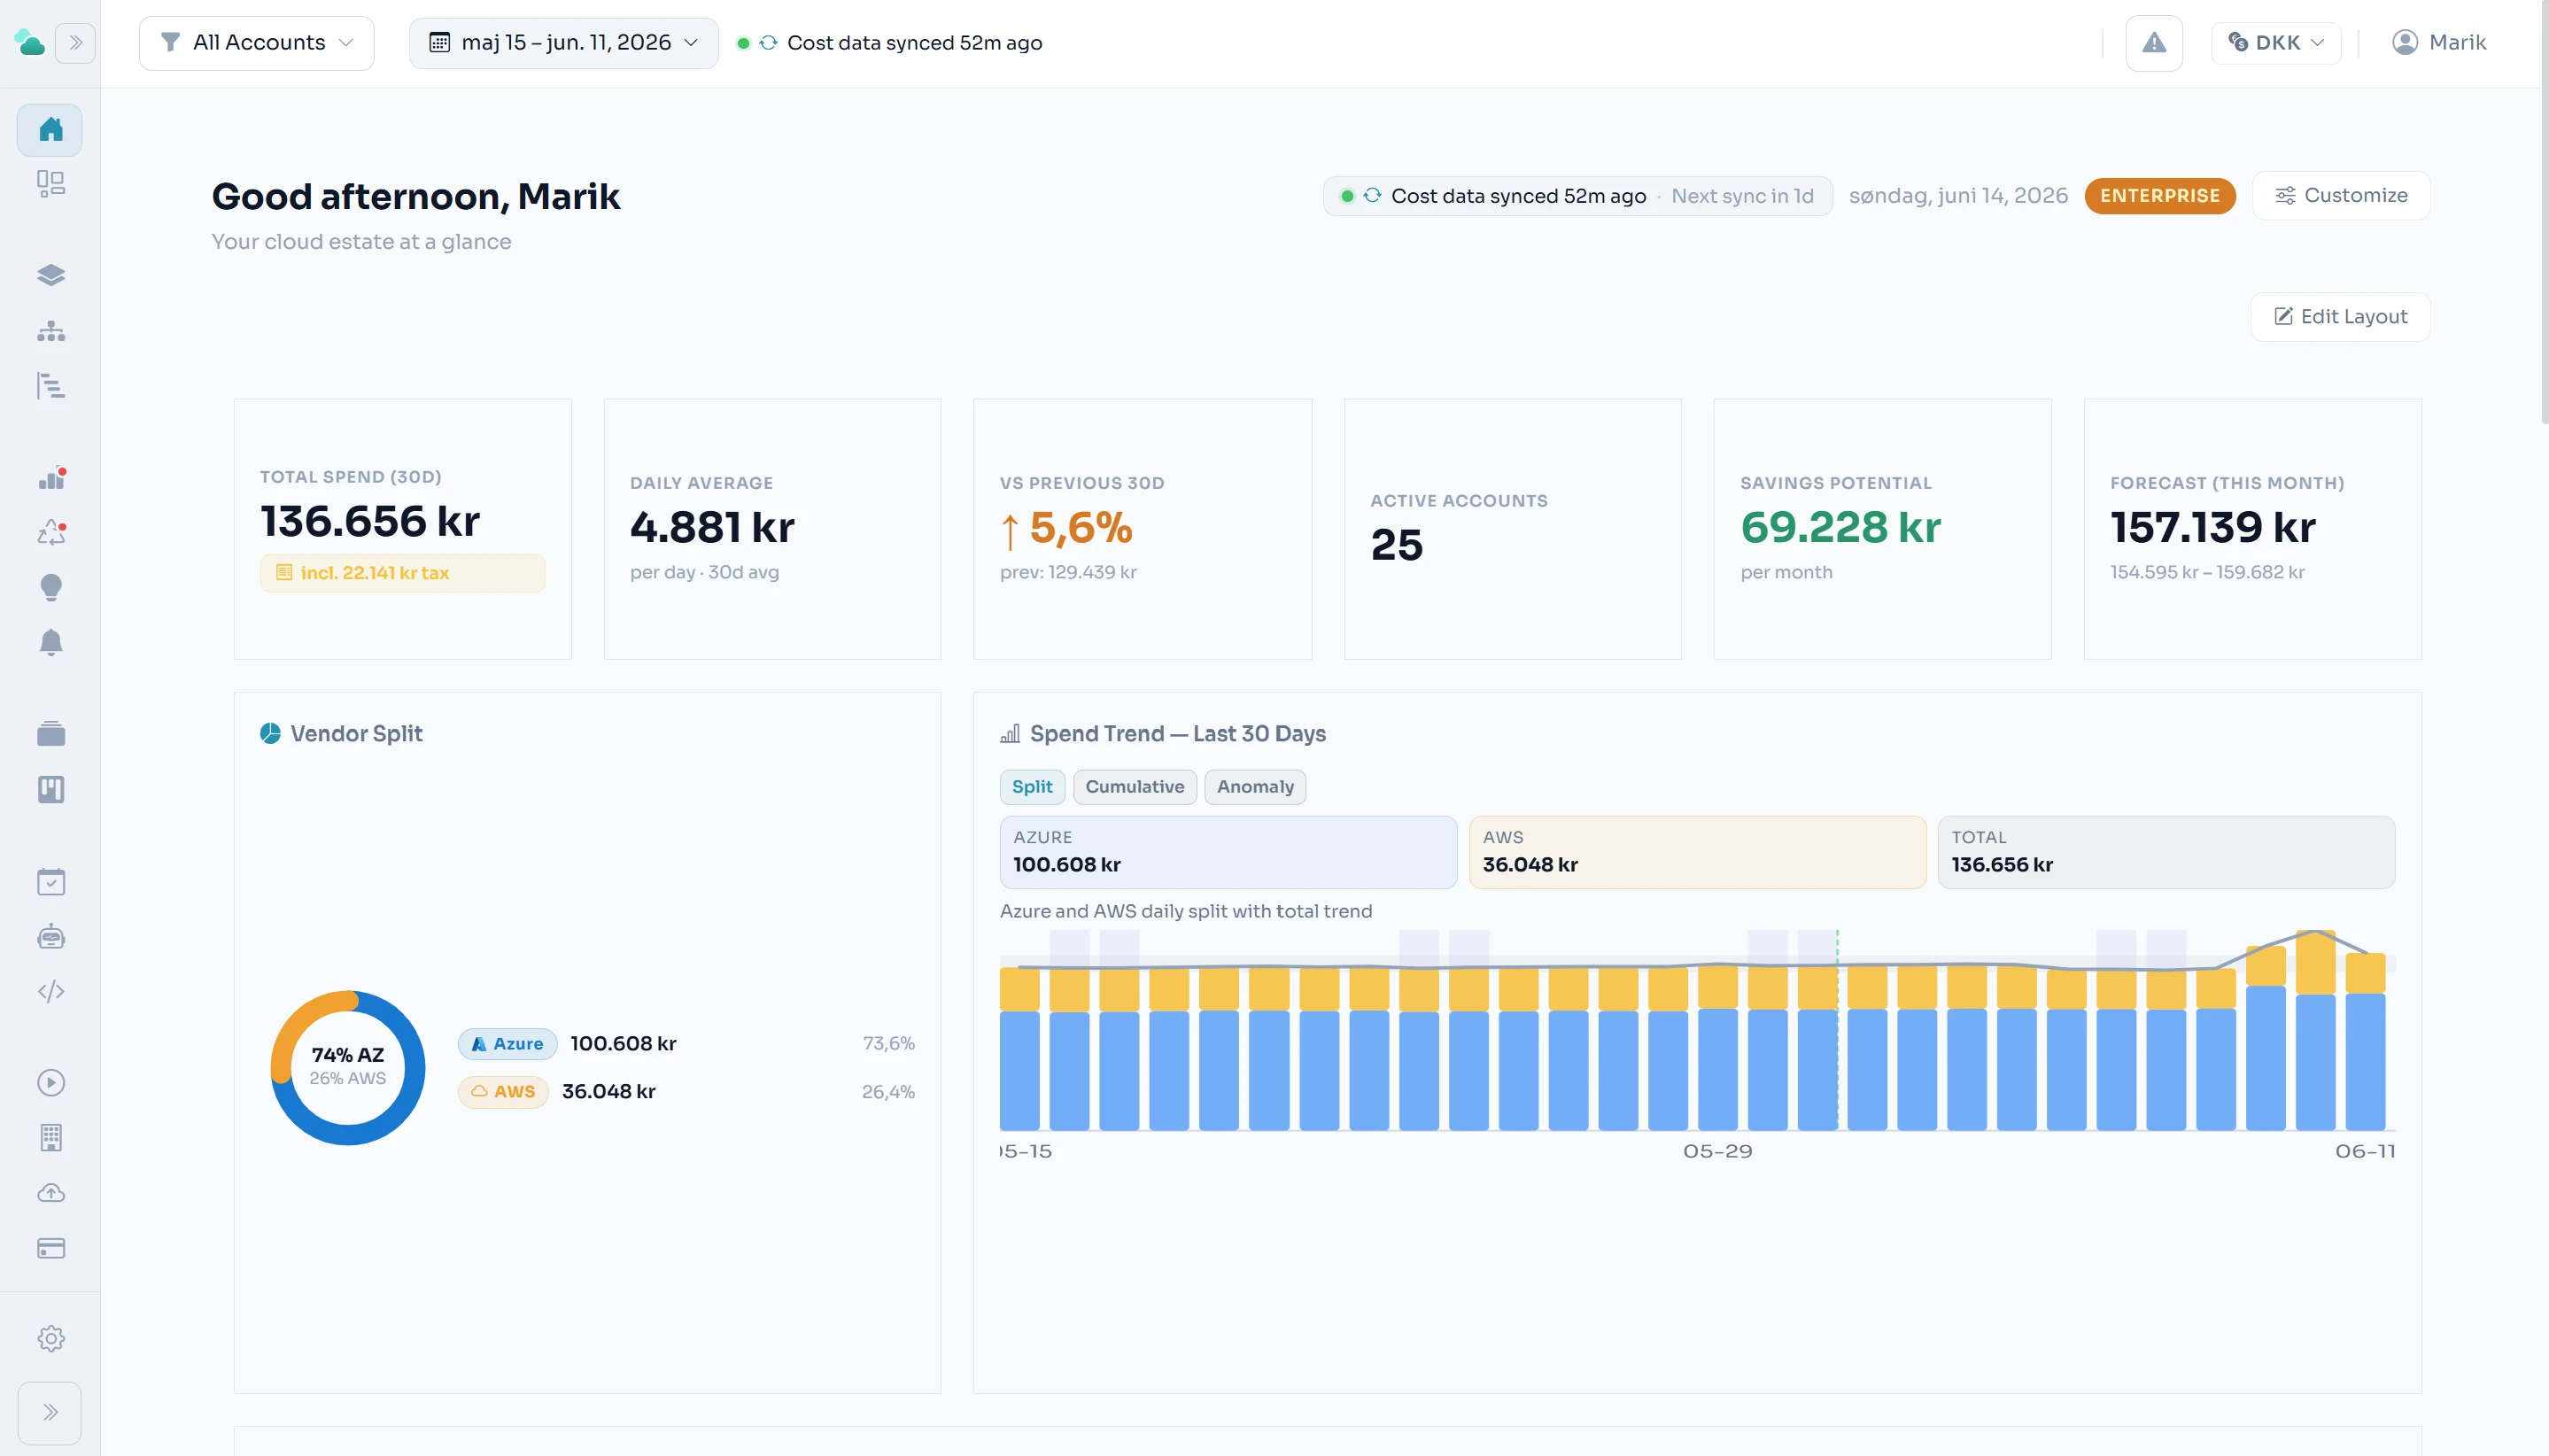
Compose dashboards from KPI tiles, charts, leaderboards, and findings — or go further and query your unified cost data directly with SQL, then pin the result as a widget.
Drag-and-drop widgets
KPIs, bar, line and donut charts, leaderboards, forecasts, and more.
Ask anything with SQL
When a chart isn’t enough, query your cost data directly and chart the result.
Follows the global filter
Every widget respects the scope you set — or pins its own.
Shared understanding
Views your whole team can rely on, not one-off spreadsheets.
Related features
See it on your numbers.
Early access — a new platform, onboarding teams now.